Omar
Atabany
I turn vendor stacks into architectures stakeholders buy and engineers can actually run_
I'm targeting Presales, Solutions, or Systems Engineer roles in networking and security. At iNetwork Solutions I lead technical discovery, sizing, and solution design across Cisco, Aruba/HPE, Fortinet, Dell, Kaspersky, and VMware, including deal registration and multi-tier single-vendor and mixed-vendor proposals. What sets that apart: I don't just design and pitch it, I build and run real infrastructure myself, using Terraform and Ansible for provisioning, Kubernetes (Talos, 3-node bare metal) with GitOps, serverless pipelines on AWS, and a self-hosted SIEM/SOAR stack, so I can speak to what a proposed architecture will actually do in production, not just what the datasheet says.
PROJECTS PRESALES & PLATFORM
I'm not asking you to hire a keyword list. The NAC and SOAR work below is real vendor solution design shipped at iNetwork Solutions: presales & NAC proof covers the architecture, design decisions, and an outage I root-caused along the way. On the technical depth behind it, DevOps proof documents the bare-metal GitOps stack end to end, AWS platform exposes a live POST /ingest demo, and GxP BioInfra is a milestone regulated-platform architecture and virtual lab (PH-00–01 complete; PH-02–03 in progress on the lab cluster, reconciled 2026-05-14).
PacketFence + Aruba NAC Deployment | iNetwork Solutions
Production Network Access Control (NAC) deployment for iNetwork Solutions' corporate wireless network. PacketFence brokers RADIUS authentication in front of Aruba Instant wireless infrastructure, with Windows AD/NPS as the primary backend and a FreeRADIUS/daloRADIUS tier for accounts outside AD.
- Automatic VLAN allocation: role-based access model where PacketFence assigns each device's VLAN dynamically at authentication time (staff, mobile, admin/IT, guest), overriding static per-SSID VLAN settings via RADIUS
- Policy and compliance: layered authentication policy across RADIUS realms, Windows NPS Network Policies gated by AD group membership, and per-account concurrent-session limits enforced via RADIUS accounting
- Traffic visibility: RADIUS Accounting wired end to end for live session state and IP-to-MAC device visibility across every connected device, without touching DHCP on any production VLAN
- Certificate-based EAP-TLS authentication via PacketFence's built-in PKI/SCEP: short-lived certs for guest self-registration, persistent certs for staff
- Hidden non-broadcast SSID for admin/IT, self-registration guest SSID with MAC authentication, and a rebuilt organizational Certificate Authority with proper autoenrollment
Security Observability & SOAR Stack | iNetwork Solutions
Self-hosted security-observability platform layered on the corporate network: Wazuh (SIEM/EDR) correlated against FortiGate, Aruba, and PacketFence telemetry through Prometheus/Loki/Grafana, with Shuffle providing automated SOAR response.
- Cross-referenced identity and device fingerprinting: merges FortiGate DHCP/UTM device classification, Aruba EAP auth-trace events, and PacketFence's identity registry into one normalized cache, correctly classifying servers, workstations, laptops, and mobile devices network-wide without relying on hostnames alone
- First automated SOAR playbook shipped end-to-end: a Wazuh critical-severity alert triggers a Shuffle webhook workflow, with a manual-approval gate before any firewall action ships (deliberate: an unattended block could outlive the threat it targeted)
- Root-caused and fixed a domain-wide authentication outage: an expired Windows CA certificate was silently breaking PEAP logins for every user; rebuilt the Enterprise CA, corrected the certificate template, and fixed a disabled autoenrollment GPO that was the true root cause
- Group Policy security audit uncovered core domain policies (Default Domain Policy, Default Domain Controllers Policy) fully disabled network-wide; re-enabled and verified after confirming no other GPO covered the gap
- Custom Prometheus exporters (Python, polling FortiGate/Aruba/PacketFence APIs) feed device inventory, per-user traffic, and true WAN-only bandwidth into unified Grafana dashboards
AWS Cloud Infrastructure Platform
Two independent pipelines in one Terraform-managed AWS account, both deployed via GitHub Actions with OIDC: zero static credentials anywhere. A serverless ingestion pipeline (API Gateway → Lambda → S3), and a separate uptime/status-monitor pipeline (EventBridge → Lambda → DynamoDB → API Gateway) with its own observability, an account-wide security baseline, and a read-only IAM bridge into the homelab's self-hosted Grafana.
- Least-privilege IAM throughout: scoped per-function execution roles, and a GitHub Actions OIDC role trimmed from Resource:* down to exactly the three Lambda ARNs it deploys to
- Policy-as-code: Checkov scans every PR's Terraform plan in CI
- CloudWatch alarms on Errors, Throttles, and Duration per Lambda, plus an API Gateway 5xx alarm that catches application-level failures a Lambda's own error handling would otherwise hide
- Account-wide security baseline: IAM Access Analyzer for continuous external-access scanning, plus a password policy aligned to NIST 800-63B
- Read-only IAM credential bridging AWS CloudWatch into the homelab's on-prem Grafana: a cross-boundary auth pattern with no AWS-side compute to assume a role from
- $0/month by design: every tradeoff (provisioned vs. on-demand DynamoDB, default CloudTrail event history vs. a Trail, GuardDuty/Config deferred) made explicitly to stay inside the AWS free tier, documented as ADRs in the repo
GxP BioInfra Platform
Regulated Kubernetes Architecture & Virtual Lab for Bioinformatics Workloads
A GxP-aligned Kubernetes platform design and virtual lab implementation for reproducible bioinformatics workloads. The project documents the target architecture, GitOps workflow, security controls, observability stack, risk register, disaster recovery procedures, incident response, secrets management, ISO 27001 mapping, and IQ/OQ/PQ-style validation evidence.
Design complete · Virtual lab implementation in progress
- Designed and currently prototyping: honest milestone work, not a claim of external audit or production certification
- Virtual lab implementation in progress to exercise GitOps, policy-as-code, runtime audit trails, and validation-style documentation
- Shows how infrastructure choices connect to change control, access management, risk, and GxP-style evidence, not just deploying tools
Home Lab Infrastructure as Code
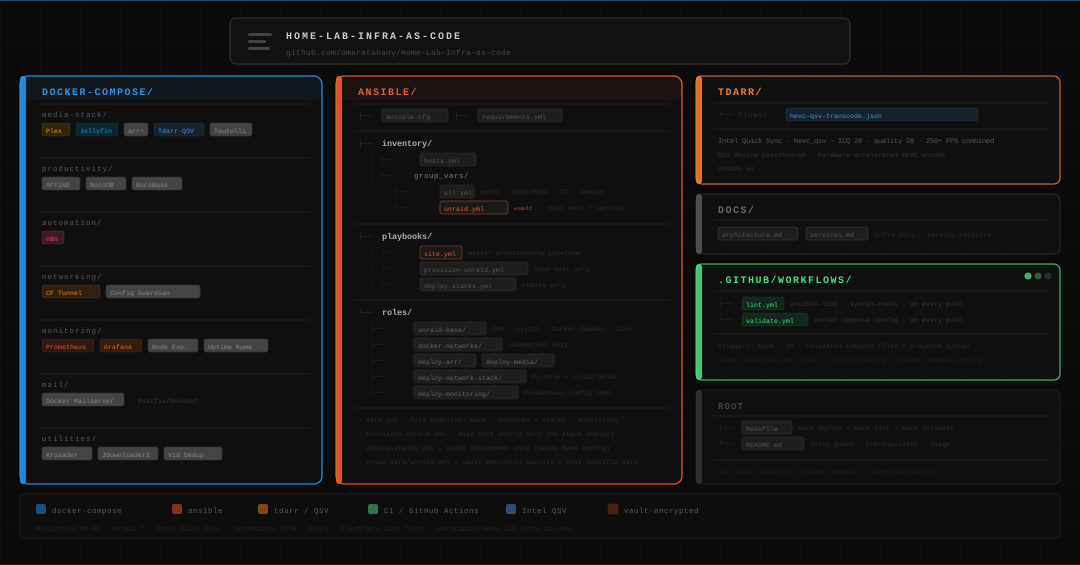
Three-layer IaC stack: Terraform (Cloudflare DNS/Tunnel/Zero Trust + Docker), Ansible (6 roles for host provisioning), Docker Compose (6 stacks + full monitoring). CI with 4 parallel jobs.
- State tracked in Git; plans and applies reviewed like application code
- Ansible idempotent roles for users, SSH, Docker, and stack bootstrap
- Monitoring stack co-located: Prometheus scrapes exporters only on the LAN
Homelab Kubernetes Talos Cluster
3-node Talos Linux cluster (two repurposed Omen gaming laptops plus a Beelink mini PC), isolated from the Unraid media/IaC stack. Full GitOps bootstrap with ArgoCD, kube-prometheus-stack monitoring, ingress-nginx, cert-manager TLS, and real internal workloads including Fabricode print job tracker.
- GitOps-first: every cluster resource and app config lives in Git; ArgoCD is the only path to apply
- Talos is immutable and API-only: no shell, no SSH, no package manager configuration drift is structurally impossible, not just discouraged
- Observability stack: Prometheus scraping cluster + app metrics, Grafana dashboards, Alertmanager configured
- Ingress, TLS, and namespace isolation aligned with how production clusters expose services safely
Cloudflare Zero Trust Home Lab Access
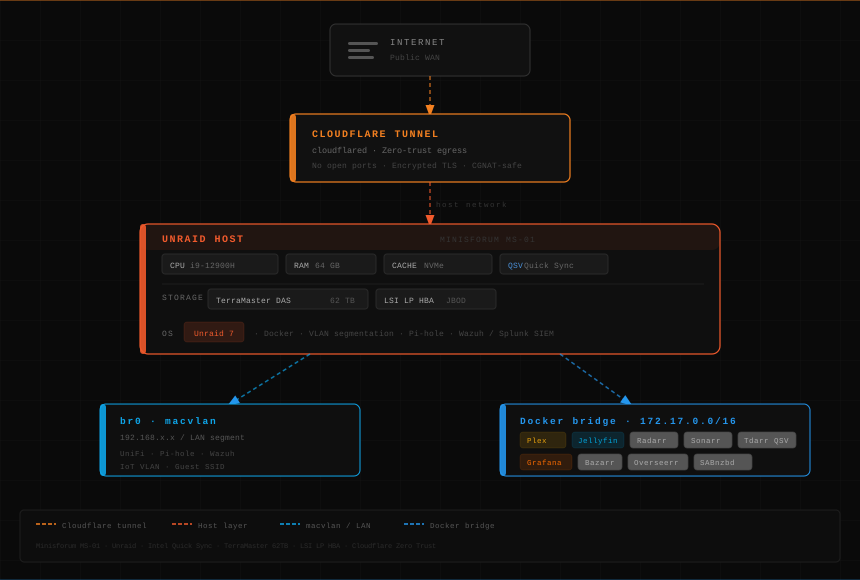
Full zero-trust remote access behind CGNAT using Cloudflare Tunnel. DNS + WAF policies managed entirely via Terraform. Domain: onetwork.cc.
- No inbound ports on home router; outbound-only tunnel to Cloudflare
- DNS, tunnel routes, and access policies codified in Terraform
SIEM Stack Wazuh + Splunk
Self-hosted security monitoring across VLAN-segmented network. Wazuh for EDR/XDR and Splunk for log aggregation and dashboards, integrated with UniFi network telemetry.
- Segmented VLANs with centralized visibility into endpoints and network flow
- Correlation between host telemetry (Wazuh) and log analytics (Splunk)
Self-Hosted Media Stack
Full Arr suite (Radarr, Sonarr, SABnzbd, Bazarr) with Plex + Jellyfin parallel serving, Tdarr HEVC transcoding via Intel Quick Sync (QSV), and Overseerr/Jellyseerr request management.
- GPU/QSV-accelerated transcoding pipelines tuned for library size vs quality
- Compose-based stack with persistent volumes and upgrade discipline
Fabricode 3D Printing & Fabrication
Separate business: FDM/SLA and laser cutting with institutional clients. Shows ownership, production discipline, and client delivery not my target stack, but the same mindset: uptime, queues, and measurable quality.
- End-to-end ownership: requirements → production → QC under real deadlines
- Parametric CAD/OpenSCAD where repeatability matters
SKILLS
- Turn vague requirements into architectures stakeholders can buy: discovery, sizing, solution design
- Vendor solution design across Cisco, Aruba/HPE, Fortinet, Dell, Kaspersky, and VMware single-vendor and mixed-vendor proposals, deal registration
- Own it past the proposal: implementation and ongoing maintenance of what I design, not just the pitch
- Looking for Presales, Solutions, or Systems Engineer roles where vendor-facing work pairs with hands-on delivery
- Treat infrastructure as code: Terraform, Ansible, Compose; peer review before apply
- Ship changes through CI (GitHub Actions): validate, lint, tests, parallel jobs
- Design for operability: metrics, logs, health checks not afterthought dashboards
- Secrets out of Git; least privilege; document how to rotate and break glass
- Talos + Kubernetes in production-like patterns: GitOps (Argo CD), Helm, ingress, TLS
- Comfortable reading pod events, probes, and controller logs under failure
- Bridge "app works locally" to "app runs reliably on a cluster"
EXPERIENCE
- Own technical and operational outcomes: uptime, throughput, and client SLAs in a production environment
- Translate vague requirements into specs, timelines, and measurable acceptance (same muscle as ticket → deployable work)
- Design parametric parts in OpenSCAD; manage FDM/SLA/laser workflows end-to-end
- Build and maintain equipment; tune firmware hands-on reliability, not only desk work
- Lead technical pre-sales: discovery, sizing, and solution design for enterprise networking and security
- Produce architectures and documentation that implementation teams can actually deploy and run
- Work across Cisco, Aruba/HPE, Fortinet, Dell, Kaspersky, and VMware stacks comfortable with complex, regulated environments
- Map vendor capabilities to customer constraints: capacity, compliance, change windows, and operational maturity
- Own implementation and ongoing maintenance of deployed client infrastructure, not just the proposal
- Deal registration and multi-tier pricing/tech-debt solution design across single-vendor and mixed-vendor proposals (Dell, Fortinet)
- Monitored and triaged security telemetry across client environments; supported threat detection workflows
- Applied DevOps practices to internal security operations tooling and automation
- Explored AI-assisted approaches to log triage and pattern detection
- Created optimized G-code and material profiles for pellet-fed and clay-extrusion 3D printers
- Built internal automation workflows using Docker, Unraid, and Tailscale to support production and remote-access operations
- Developed experimental monitoring workflows to improve production visibility and maintenance planning
- Handled client-facing technical sales: quoting, capability demos, and order scoping for commercial print runs
- Coordinated technical requirements between clients and production for custom fabrication orders
- Operated and maintained a fleet of FDM and SLA printers for commercial production runs
- Handled client CAD-to-print workflows and post-processing (sanding, painting, coating)
- Worked on front end development and internal systems management
LIVE OBSERVABILITY
Production-style posture at homelab scale: Node Exporter on the MS-01, Prometheus internal, Grafana as the read path. Hardware: Minisforum MS-01 · Unraid · ~62TB DAS · UniFi
What you're seeing: real time series from this stack (Node Exporter → Prometheus → Grafana), embedded over HTTPS via Cloudflare Tunnel. It's the same shape I'd run with a team: metrics first, Prometheus never public, Grafana gated at the edge. Panels refresh on a short interval; if one is blank, the tunnel or host may be in maintenance.
Browsers only talk to Grafana over HTTPS (Cloudflare Tunnel → Unraid :3101). Grafana queries Prometheus via an internal Docker network URL. Prometheus never needs a public hostname.
How the infra-as-code repo is organized (stacks, roles, modules).